
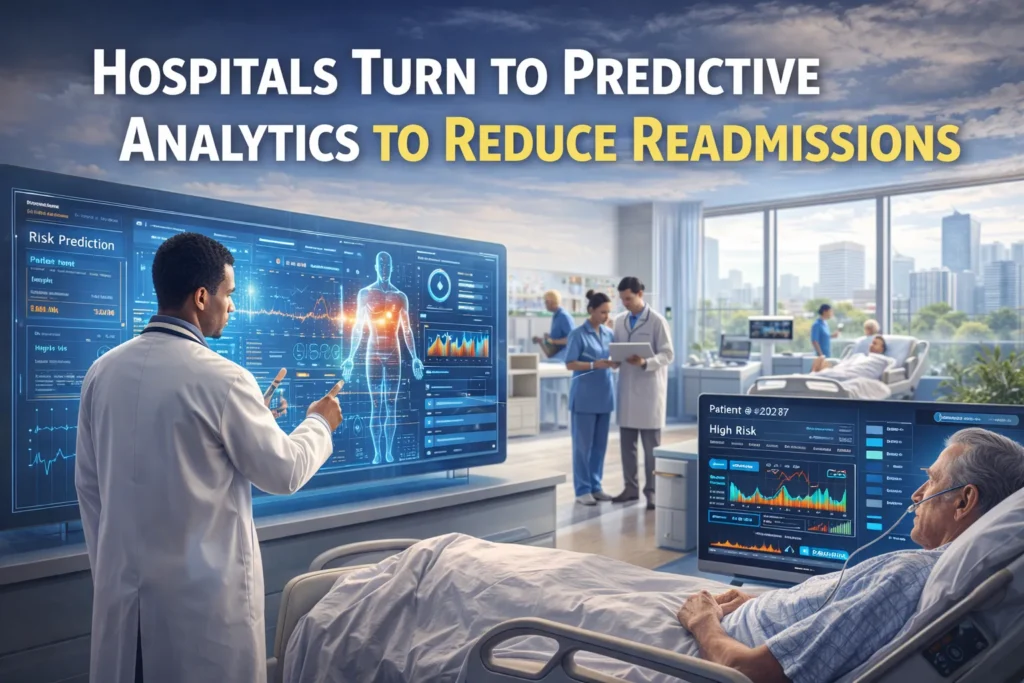
Prologue: The Silent Crisis in American Hospitals
In the hushed corridors of hospitals across the United States, a quiet epidemic unfolds daily—one measured not in contagion but in cycles of return. Each year, millions of patients experience what healthcare professionals call “the revolving door”: discharged from the hospital only to return within weeks, sometimes days, often sicker than before. This phenomenon of hospital readmissions represents one of healthcare’s most persistent failures—a breakdown in the transition from acute care to sustainable recovery that costs billions and diminishes countless lives.
The human stories behind the statistics are varied yet uniformly distressing. Consider 72-year-old Robert, discharged after a successful hip replacement, only to return 18 days later with a severe surgical site infection. Or Maria, a 58-year-old diabetic managing congestive heart failure, whose careful balancing act collapses two weeks post-discharge when confusion about her complex medication regimen leads to dangerous fluid retention. These are not anomalies but regular occurrences in a system struggling to bridge the gap between institutional care and home recovery.
The financial implications are staggering. The Center for Medicare and Medicaid Services (CMS) estimates that avoidable hospital readmissions cost the U.S. healthcare system between $15-$26 billion annually. For Medicare alone, approximately $17 billion is spent each year on return hospital visits within 30 days of discharge. But beyond economics lies a deeper professional failing—the inability to reliably predict which patients will struggle after leaving medical supervision, and to intervene before minor setbacks become full-blown crises.
For decades, healthcare providers operated with what amounted to educated guesswork in discharge planning. Risk assessment was often subjective, based on clinical intuition rather than systematic analysis. Resources for transitional support were allocated broadly rather than precisely, inevitably missing some high-risk patients while potentially over-serving others. This changed with the 2012 introduction of the Hospital Readmissions Reduction Program (HRRP), which created substantial financial penalties for hospitals with higher-than-expected readmission rates for specific conditions. Suddenly, what had been a quality concern became an urgent financial imperative—and the search for better predictive tools began in earnest.
Section 1: The Evolution of Predictive Analytics in Medicine
1.1 From Retrospection to Prediction: A Paradigm Shift
The journey of predictive analytics in healthcare mirrors the broader data revolution but carries unique complexities. Historically, medical data analysis was overwhelmingly retrospective—examining past outcomes to understand trends, evaluate interventions, and justify reimbursements. The quarterly readmission report, arriving weeks after the fact, was typical of this approach: meticulously documenting failures that could no longer be prevented.
Predictive analytics represents a fundamental paradigm shift from asking “What happened?” to asking “What will happen?” This transition has been enabled by three converging developments:
- The digitization of health records: The widespread adoption of Electronic Health Records (EHRs), accelerated by the HITECH Act of 2009, created structured, searchable patient data where paper records offered only narratives.
- Advances in machine learning: The development of sophisticated algorithms capable of identifying complex, non-linear patterns in large datasets moved analysis beyond simple regression models.
- Computational power and storage: Cloud computing and scalable data infrastructure made it feasible to process the enormous volumes of data generated in healthcare settings.
The philosophical implications are profound. Medicine has always been probabilistic—physicians weigh likelihoods and make judgments under uncertainty. Predictive analytics quantifies these probabilities with unprecedented precision, transforming clinical intuition into computable risk scores. It represents not the replacement of clinical judgment but its augmentation with systematic, data-driven insight.
1.2 The Anatomy of a Predictive Model
Understanding how predictive models work demystifies their application. At its core, a readmission prediction model is a mathematical function that takes patient characteristics as inputs and produces a probability of readmission as output. The development of such a model follows a rigorous, multi-stage process:
Data Acquisition and Integration
The foundation of any predictive model is data. Modern hospitals generate staggering amounts of information, but it resides in fragmented systems: primary EHRs, laboratory information systems, pharmacy databases, billing systems, and increasingly, patient-reported outcomes collected through portals. The first technical challenge is creating a unified data warehouse through Extract, Transform, Load (ETL) processes that reconcile different data formats, coding standards, and patient identifiers.
Feature Engineering and Selection
Raw data elements are transformed into “features”—measurable properties that might predict readmission. This is where data science meets clinical expertise. Simple features might include age, number of previous admissions, or specific lab values. More sophisticated features might combine elements: a “medication complexity index” derived from the number of medications, dosing frequency, and special administration requirements; or a “social vulnerability score” incorporating zip-code-level data on poverty, transportation access, and food deserts.
The feature selection process is critical. Too many features can lead to overfitting, where the model performs well on historical data but poorly on new patients. Domain knowledge helps prioritize clinically meaningful variables. Studies have shown that the most predictive features often fall into several categories:
- Clinical factors: Specific diagnoses (e.g., heart failure, COPD), laboratory abnormalities, procedural complications
- Utilization history: Frequency of prior admissions, emergency department visits, length of current stay
- Medication-related factors: Polypharmacy (especially ≥10 medications), high-risk medications, anticoagulation therapy
- Functional and cognitive status: Dementia diagnosis, mobility limitations, activities of daily living dependencies
- Social determinants of health: Living alone, limited social support, health literacy barriers, transportation challenges
Algorithm Selection and Training
Multiple machine learning approaches can be applied to readmission prediction:
| Algorithm Type | Mechanism | Strengths | Weaknesses | Common Use Cases |
|---|---|---|---|---|
| Logistic Regression | Models probability using logistic function | Highly interpretable, computationally efficient | Assumes linear relationships, may miss complex interactions | Baseline models, when interpretability is paramount |
| Random Forests | Ensemble of decision trees voting on outcome | Handles non-linear relationships well, robust to outliers | Less interpretable than linear models, can overfit | High-performance applications where some “black box” nature is acceptable |
| Gradient Boosting Machines (XGBoost) | Sequentially builds trees that correct previous errors | Often state-of-the-art performance, handles missing data well | Computationally intensive, requires careful tuning | Competitions and high-stakes applications where accuracy is critical |
| Neural Networks | Multiple layers of interconnected “neurons” | Can model extremely complex patterns, learns feature hierarchies | “Black box” nature, requires very large datasets, computationally intensive | When massive datasets are available and interpretability is secondary |
Validation and Performance Metrics
Before deployment, models undergo rigorous validation. Typically, historical data is divided into three sets:
- Training set (60-70%): Used to estimate model parameters
- Validation set (15-20%): Used to tune hyperparameters and select between models
- Test set (15-20%): Used for final, unbiased performance evaluation
Performance is measured using multiple metrics:
- Area Under the Receiver Operating Characteristic Curve (AUC-ROC): Measures the model’s ability to distinguish between patients who will and won’t be readmitted across all possible threshold values. An AUC of 0.5 indicates random guessing; 0.7-0.8 is considered good; above 0.8 is excellent.
- Precision and Recall: Precision measures what percentage of patients predicted to be readmitted actually were (avoiding false alarms). Recall measures what percentage of actual readmissions were correctly predicted (avoiding misses).
- Calibration: Whether predicted probabilities match observed frequencies (e.g., of patients given a 30% risk, do about 30% actually get readmitted?).
Implementation and Integration
The most sophisticated model fails if not properly integrated into clinical workflows. Successful implementation requires:
- Real-time scoring: Models must generate predictions quickly as patient conditions change, not just at discharge.
- EHR integration: Risk scores should appear naturally in clinician workflows—in patient lists, discharge planning modules, or as alerts.
- Actionable outputs: Beyond a numerical score, the best systems provide contextual information: “High risk due primarily to medication complexity and limited social support” suggests different interventions than “High risk due to abnormal lab values and previous early readmission.”
Section 2: The Data Ecosystem of Modern Healthcare
2.1 Clinical Data: The Foundation of Prediction
The predictive analytics revolution rests on the comprehensive digitization of patient care. Modern Electronic Health Records (EHRs) have evolved from digital replacements for paper charts to sophisticated clinical data repositories capturing hundreds of data elements per patient encounter. These systems document everything from vital signs and laboratory results to progress notes, problem lists, and medication administration records.
The richness of this data enables nuanced prediction, but also presents challenges. Clinical narrative—the free-text notes written by physicians, nurses, and other providers—contains invaluable information about patient complexity, social circumstances, and subtle clinical findings. However, extracting structured information from unstructured text requires Natural Language Processing (NLP) techniques. Advanced NLP systems can now identify mentions of symptoms, social determinants (“patient reports inability to afford medications”), and even clinical uncertainty (“concern for possible early infection”) that might not be captured in structured fields.
Temporal patterns in clinical data are particularly predictive. It’s not just a patient’s most recent creatinine level that matters, but how it has changed over the hospitalization. A trajectory analysis that identifies patients whose lab values are trending negatively even at discharge—the “discharge destabilization” pattern—can flag those at highest risk despite meeting standard discharge criteria.
2.2 Beyond the Hospital Walls: Incorporating Social Determinants
A profound limitation of early readmission prediction models was their narrow focus on clinical data from the hospitalization itself. This ignored the reality that what happens after discharge—in patients’ homes, communities, and social circumstances—often determines their success far more than what happened in the hospital.
The integration of Social Determinants of Health (SDOH) data represents perhaps the most significant advancement in predictive modeling for readmissions. These non-medical factors account for an estimated 50-60% of health outcomes, yet were largely absent from traditional risk models. Modern approaches systematically incorporate:
- Socioeconomic factors: Income level, education, employment status, insurance type
- Physical environment: Housing stability, neighborhood safety, access to healthy food, transportation availability
- Social context: Marital status, living arrangements, social support networks, caregiver availability
- Health behaviors: Health literacy, medication adherence history, engagement with preventive care
Innovative health systems are gathering this data through multiple channels:
- Structured screening tools administered during admission
- Geocoding patient addresses to link to neighborhood-level data (food desert maps, walkability scores, poverty indices)
- Community partnership data from social service agencies
- Patient-reported data collected through portals or mobile applications
The University of Pennsylvania Health System’s “MyHealthyGains” program exemplifies this approach. By combining EHR data with neighborhood-level socioeconomic information from the American Community Survey and patient-reported SDOH factors, they achieved a 22% improvement in model accuracy compared to clinical data alone. More importantly, the model directed resources more equitably—identifying high-risk patients who would have been missed by purely clinical models.
2.3 Real-Time Data Streams and Remote Monitoring
The predictive horizon is expanding from the inpatient stay to the post-discharge period through continuous data collection. Remote Patient Monitoring (RPM) technologies create constant streams of physiological data from patients’ homes: blood pressure, weight, glucose levels, oxygen saturation, and medication adherence (via smart pill bottles).
When integrated with predictive analytics, RPM enables dynamic risk assessment. Rather than a single prediction at discharge, systems can continuously update risk scores as new data arrives. An algorithm might detect the subtle weight gain (indicative of fluid retention in heart failure patients) three days before symptoms become noticeable, triggering a nurse call for early diuretic adjustment that prevents an emergency department visit.
The emerging field of digital phenotyping—using smartphone sensors to passively collect data on mobility, sleep patterns, social interaction, and cognitive performance—promises even more nuanced prediction. Research at Stanford has demonstrated that changes in typing speed and regularity on a smartphone can predict cognitive decompensation in elderly patients days before clinical manifestation.
Section 3: Implementation Science: From Prediction to Intervention
3.1 Closing the Loop: The Intervention Imperative
Prediction without intervention is merely anticipation. The true value of predictive analytics emerges only when risk stratification triggers targeted, evidence-based actions. This requires moving beyond the model itself to design clinical pathways that translate risk scores into concrete care plans.
Effective intervention design follows several principles:
Risk-Stratified Resource Allocation
Not all high-risk patients need the same intensity of support. Sophisticated systems implement tiered interventions:
| Risk Tier | Probability of Readmission | Example Interventions | Resource Intensity |
|---|---|---|---|
| Low Risk | <10% | Standard discharge instructions, follow-up appointment scheduled | Minimal |
| Medium Risk | 10-25% | Nurse discharge call within 48 hours, medication reconciliation, simplified instructions | Moderate |
| High Risk | 25-40% | Pre-discharge multidisciplinary huddle, post-discharge home visit, transition coach assignment | High |
| Very High Risk | >40% | Early palliative care consultation, complex case management, remote monitoring, direct scheduling of follow-up | Very High |
Multidisciplinary Team Activation
High-risk patients typically have complex needs spanning medical, psychological, social, and functional domains. Effective intervention requires coordinated action from:
- Transitional care nurses specializing in discharge coordination
- Clinical pharmacists conducting medication reconciliation and simplification
- Social workers addressing socioeconomic barriers
- Community health workers bridging hospital and home
- Primary care providers ensuring continuity
The Project RED (Re-Engineered Discharge) model, developed at Boston University Medical Center, exemplifies this team-based approach. When their predictive model flags a high-risk patient, it automatically triggers a standardized protocol including a customized discharge plan, a “After Hospital Care Plan” written in plain language, scheduled follow-up appointments before discharge, and a nurse follow-up call within 72 hours. In randomized trials, Project RED reduced 30-day readmissions by 30% compared to standard care.
Timing and Sequencing
Interventions must be timed appropriately. Some actions are most effective pre-discharge (medication reconciliation, caregiver education), while others have maximum impact in the immediate post-discharge period (follow-up calls, home visits). The highest-performing systems map interventions across the entire transition timeline:
- Pre-discharge (24-48 hours before discharge): Comprehensive discharge planning, medication reconciliation, patient/caregiver education
- Day of discharge: Simplified instructions, confirmed follow-up appointments, discharge packet review
- Early post-discharge (0-72 hours): Follow-up call, confirmation of understanding, urgent issue resolution
- Intermediate post-discharge (3-14 days): Home visit, medication adherence check, early follow-up appointment
- Late post-discharge (14-30 days): Ongoing monitoring, reinforcement, chronic disease management
3.2 Technological Integration and Workflow Design
The most common failure point in predictive analytics implementation is poor integration with existing clinical workflows. Clinicians already face cognitive overload and documentation burdens; a new alert system that demands extra clicks and interrupts workflow will be ignored or actively resisted.
Successful integration follows human-centered design principles:
Seamless EHR Integration
Predictive insights should appear within existing screens clinicians already use, not on separate dashboards requiring additional logins. Best practices include:
- Embedded risk scores in patient list views, allowing rapid prioritization
- Contextual alerts within progress note templates, suggesting documentation of risk factors
- Automated order sets triggered by risk scores, simplifying the process of ordering appropriate interventions
- Discharge planning modules that incorporate risk stratification into transition planning
Intelligent Alerting
Alert fatigue is a legitimate concern. Sophisticated systems use adaptive alerting strategies:
- Risk-threshold-based alerts that only interrupt workflow for highest-risk patients
- Escalation pathways where initial alerts go to nurses or case managers, with physician alerts reserved for most urgent cases
- Snooze and deferral options that respect clinical workflow while ensuring follow-up
- “Alert holidays” that suppress notifications during high-intensity periods like rounds or procedures
Closed-Loop Feedback Systems
Predictive models must continuously learn and improve. The most advanced systems incorporate continuous model recalibration based on new outcomes data. Perhaps more importantly, they track not just whether interventions were delivered, but whether they were effective. This creates a learning cycle:
- Model identifies high-risk patient
- Clinical team delivers targeted intervention
- System tracks whether readmission was prevented
- Data feeds back to refine both the model and the intervention protocols
3.3 Measuring Success: Beyond Readmission Rates
While reducing readmissions is the primary goal, comprehensive evaluation requires multiple metrics:
Clinical Outcomes
- 30-day all-cause readmission rate: The standard metric, but should be risk-adjusted
- Condition-specific readmission rates: Particularly for target conditions like heart failure, pneumonia, COPD
- Time to readmission: Earlier readmissions may indicate different failure modes than later ones
- Emergency department visits without admission: May represent “near misses”
- Mortality rates: Important to ensure interventions aren’t preventing readmission at the cost of increased mortality
Process Measures
- Intervention delivery rates: What percentage of high-risk patients received recommended interventions?
- Timeliness of follow-up: What percentage had follow-up within 7 days? 14 days?
- Medication reconciliation completion rates
- Patient understanding assessments
Patient-Reported Outcomes
- Care transition quality measures (CTM-3)
- Patient activation and self-efficacy
- Health-related quality of life
Economic Metrics
- Return on investment: Total savings versus program costs
- Avoided penalty calculations: Reduction in HRRP penalties
- Bed-day savings: Increased capacity from avoided readmissions
- Staff efficiency gains: Though often redistributed rather than reduced
The University of Utah Health System’s implementation offers a comprehensive example. Beyond reducing readmissions by 18%, they documented a 22% increase in patient satisfaction with discharge planning, a 35% improvement in follow-up appointment completion, and a net $3.2 million annual savings after accounting for program costs and avoided penalties.
Section 4: Ethical Considerations and Algorithmic Governance
4.1 The Bias Problem in Healthcare Algorithms
Predictive models risk perpetuating and even amplifying existing healthcare disparities if not carefully designed and monitored. The now-famous 2019 study in Science revealed how a widely used commercial algorithm systematically underestimated the illness severity of Black patients because it used healthcare costs as a proxy for health needs—failing to account for structural barriers that limit care access regardless of need.
Three primary bias mechanisms threaten predictive models:
Data Representation Bias
If training data underrepresents certain populations, the model will perform poorly for those groups. Historical healthcare data often reflects existing inequities in access—marginalized communities may have sparser records not because they’re healthier, but because they’ve had less opportunity to engage with the healthcare system.
Label Bias
In readmission prediction, the “ground truth” label—whether a patient was actually readmitted—may itself be biased. Patients with better access to alternative care settings (urgent care, telehealth) or greater tolerance for managing illness at home may be less likely to be readmitted even when equally ill. Models trained on such labels will learn to deprioritize patients who appropriately seek readmission when necessary.
Measurement Bias
Clinical measurements may be inconsistently collected across populations. For example, pain—a subjective but important vital sign—may be under-documented in populations where stoicism is culturally valued or where clinician biases discount patient reports.
Mitigating algorithmic bias requires proactive strategies:
- Disparity impact assessments during model development
- Stratified performance reporting across racial, ethnic, gender, and socioeconomic groups
- Bias-aware algorithms that explicitly optimize for equitable performance
- Diverse development teams that can identify potential blind spots
4.2 Transparency, Explainability, and Clinician Trust
The “black box” problem—where complex models produce predictions without interpretable reasoning—poses significant barriers to clinical adoption. A survey of physicians at a major academic medical center found that 73% would be unlikely to follow an AI recommendation without understanding its rationale, even if proven accurate.
Explainable AI (XAI) techniques are evolving to address this:
- Local interpretable model-agnostic explanations (LIME): Creates simple, interpretable models that approximate the complex model’s behavior for individual predictions
- SHAP (SHapley Additive exPlanations): Assigns each feature an importance value for a specific prediction, showing how much each factor contributed
- Counterfactual explanations: Shows what would need to change to alter the prediction (e.g., “If the patient’s sodium level were 5 points higher, their risk would drop from high to medium”)
Beyond technical solutions, establishing algorithmic governance structures is essential:
- Clear accountability: Designated owners for model performance and updates
- Clinician oversight committees: Regular review of model performance and edge cases
- Appeal and override mechanisms: Clear processes for clinicians to contest predictions
- Continuous monitoring: Tracking of model drift and performance degradation over time
4.3 Privacy, Consent, and Data Stewardship
Predictive analytics raises complex privacy questions, particularly as models incorporate increasingly diverse data sources beyond traditional clinical records. The ethical use of patient data for predictive modeling navigates between two legitimate values: the collective benefit of improved care through data analysis, and individual rights to privacy and autonomy.
Emerging frameworks for data stewardship emphasize:
- Purpose specification: Clear articulation of how data will be used to improve care
- Proportionality: Data collection commensurate with clinical benefit
- Transparency: Patients informed about data use in predictive modeling
- Accountability: Clear responsibility for appropriate data use
Some health systems are implementing dynamic consent models that allow patients granular control over how their data is used for secondary purposes like predictive model development, while maintaining its use for direct clinical care.
Section 5: The Future Trajectory of Predictive Healthcare
5.1 From Reactive to Proactive: Predictive Prevention
The logical evolution of readmission prediction is admission prevention. Health systems are expanding predictive analytics upstream to identify community-dwelling individuals at high risk of hospitalization before they ever reach the emergency department.
Population health prediction models analyze claims data, pharmacy fills, primary care visits, and social determinants to flag individuals who would benefit from proactive intervention. Kaiser Permanente’s “Advanced Risk Stratification” program identifies members at highest risk of future hospitalization and enrolls them in intensive care management programs, achieving 15-20% reductions in anticipated hospitalizations.
The integration of consumer-generated health data from wearables, smartphones, and connected home devices creates unprecedented opportunities for early detection. Research partnerships between Apple and healthcare institutions have demonstrated that data from Apple Watches can detect physiological changes predictive of cardiac decompensation weeks before clinical presentation.
5.2 Personalized Medicine in Care Transitions
Future models will move beyond population-level predictions to truly personalized recommendations. Rather than simply identifying high-risk patients, systems will generate individualized risk profiles that specify not just likelihood of readmission, but the specific drivers of that risk and the most effective mitigation strategies.
Precision discharge planning might analyze thousands of similar historical cases to identify which intervention combinations worked best for patients with a specific profile: “For patients with heart failure, depression, and low health literacy similar to this patient, the most effective intervention combination was: (1) pictogram-based medication instructions, (2) weekly telehealth check-ins, and (3) a transition buddy program.”
5.3 Integration with Advanced Technologies
Several technological convergences will shape the next generation of predictive analytics:
Generative AI and Large Language Models
Tools like GPT-4 and specialized medical LLMs can synthesize complex patient information into coherent risk narratives, generate personalized patient education materials at appropriate literacy levels, and even simulate potential post-discharge scenarios to identify vulnerabilities.
Digital Twins in Healthcare
The concept of creating a “digital twin”—a comprehensive computational model of an individual patient—moves from manufacturing to medicine. By simulating how a specific patient might respond to different discharge plans or interventions, health systems could test alternatives virtually before implementing them in reality.
Blockchain for Care Continuity
Distributed ledger technology could create seamless, secure sharing of predictive risk scores across care settings—from hospital to skilled nursing facility to home health agency—ensuring consistent risk-aware care throughout the transition journey.
Quantum Computing
Though further horizon, quantum algorithms promise exponential speed improvements for analyzing the complex, high-dimensional datasets that characterize healthcare, potentially unlocking patterns currently invisible to classical computing.
5.4 Policy and Payment Alignment
The full potential of predictive analytics requires alignment between technological capability and payment structures. Current fee-for-service models may inadvertently discourage some effective interventions by not reimbursing for services like comprehensive medication review or post-discharge follow-up calls.
Value-based care arrangements, where providers share in savings from avoided readmissions, create natural incentives for predictive analytics investment. The most advanced Alternative Payment Models (APMs) are beginning to incorporate provisions for “predictive analytics as a covered benefit,” recognizing that upfront investment in prediction and prevention generates downstream savings across the healthcare system.
The CMS Innovation Center has launched several models testing payment structures that support predictive analytics, including the Accountable Care Organization Realizing Equity, Access, and Community Health (ACO REACH) model, which provides enhanced payments for addressing health-related social needs identified through predictive screening.
Section 6: Case Studies of Transformative Implementation
6.1 Geisinger Health System: Predictive Analytics in an Integrated Delivery Network
Pennsylvania-based Geisinger Health System operates in predominantly rural communities with older, sicker populations facing significant socioeconomic challenges. Their “ProvenHealth Navigator” advanced medical home model integrates predictive analytics across the care continuum.
Key Innovations:
- Primary care-based risk stratification: Every patient in primary care receives a quarterly updated risk score based on clinical and claims data
- Community health worker integration: High-risk patients are assigned community health workers who address both medical and social needs
- Preemptive hospitalist service: For highest-risk patients approaching likely admission, hospitalists conduct home visits to manage issues before crisis
Results:
- 29% reduction in 30-day readmissions across their Medicare population
- $12.3 million in annual savings from avoided readmissions
- Highest patient satisfaction scores in their region for care transitions
6.2 Intermountain Healthcare: The Power of Simplicity
Utah’s Intermountain Healthcare took a deliberately different approach, focusing on a simple, highly interpretable model that gained rapid clinician trust rather than pursuing maximum algorithmic complexity.
Key Innovations:
- The “15-Point Readmission Risk Score”: A deliberately simple additive model using 15 easily understood factors (e.g., +2 points for age >75, +3 points for heart failure diagnosis, +4 points for living alone)
- Nurse-driven intervention protocol: Unit nurses calculate scores at admission and day before discharge, triggering standardized interventions
- Real-time performance feedback: Units see daily how their risk-stratified interventions correlate with readmission rates
Results:
- 21% reduction in observed-to-expected readmission ratio within 18 months
- 94% nurse adherence to risk assessment protocol (unusually high for clinical decision support)
- Rapid spread to 22 hospitals within the system based on early success
6.3 Singapore Health Services: A National Digital Infrastructure
Singapore’s public healthcare system offers perhaps the most comprehensive example of predictive analytics at national scale through its “Hospital to Home (H2H)” initiative.
Key Innovations:
- National EHR with embedded predictive analytics: Every public hospital uses the same risk model integrated into a shared EHR
- Cross-institutional care coordination: Risk scores and care plans follow patients across all public healthcare facilities
- Community partnership portal: Social service agencies access de-identified risk maps to target community resources
Results:
- 35% reduction in avoidable readmissions for targeted conditions
- 7-day post-discharge mortality reduced by 41%
- Highest-rated healthcare system in the world by the Bloomberg Health Care Efficiency Index
Conclusion: The Human-Machine Partnership in Healthcare’s Future
The story of predictive analytics in reducing hospital readmissions is ultimately not about technology replacing human judgment, but about augmenting human capability. It represents a fundamental reimagining of how healthcare systems anticipate and respond to patient vulnerability during one of medicine’s most perilous passages—the transition from hospital to home.
The most successful implementations share a common characteristic: they use technology not to automate care, but to make human care more thoughtful, more timely, and more precisely targeted. The predictive model doesn’t replace the nurse’s intuition; it directs that intuition to where it’s most needed. It doesn’t eliminate the physician’s judgment; it provides that judgment with richer information. It doesn’t reduce care to algorithms; it uses algorithms to ensure that care remains profoundly human.
As healthcare continues its digital transformation, the lessons from readmission prediction will resonate across medicine. The same principles of data integration, risk stratification, targeted intervention, and continuous learning apply to preventing surgical complications, managing chronic diseases, optimizing treatment selection, and personalizing preventive care.
The challenge ahead lies not in developing more sophisticated algorithms—though that will continue—but in building the organizational capabilities, ethical frameworks, and human-centered workflows that allow these tools to fulfill their promise. It requires moving beyond the technical question of “Can we predict?” to the more profound human question: “Knowing what we can predict, how will we care differently?”
In hospitals that have embraced this approach, the revolving door hasn’t just slowed—it has been replaced by a guided pathway. Patients leave not with just a folder of instructions and a hope for the best, but with a support system activated by foresight, a safety net woven from data and human compassion. They transition not from the hospital’s care to their own uncertainty, but from one form of careful attention to another. This is the true potential of predictive analytics: not merely to reduce readmission rates, but to extend the circle of care beyond hospital walls, creating a continuity of healing that honors both the complexity of disease and the dignity of those who live with it.
The quiet revolution in hospital corridors continues, measured not in dramatic breakthroughs but in thousands of small victories—the infections prevented, the medications understood, the crises averted, the lives kept on track. In these accumulating successes, predictive analytics finds its highest purpose: not as an end in itself, but as a means to the oldest and most human of medical imperatives—to heal, to comfort, and to do no harm.


Салют,
Коллеги.
Сегодня я бы хотел оповестить немного про заработок трафик.
Я думаю Вы искали реально про
ГЕО!
Значит эта наиболее актуальная информация про таргетинг реклама будет для вас наиболее будет полезной.
Мы предлагаем больше полезностей про трафик заработок или про таргетинг реклама, возможно и про crypto casi?
На нашем сайте больше про веб трафик сайт,
Проверенные ссылки! Качественные обратные ссылки проверенные
опытом!
НАШ SEO WEBSITE – биржа крипто: https://t.me/seovtop/261 –
2025 биржа реклам
Только, если Вы реально искали информацию про работа биржа,
а также про jucrypto, та вы найдете самую свежую и актуальную информацию про
crypto casi или возможно хотите купить ссылки.
Вы найдете много предложений для crypto casi
– а именно про web coin и про crypto casi.
Входите с нами в контакт на нашем сайте и вы наверняка найдете популярную и самую актуальную информацию от экспертов по поводу следующих тем касающихся нижеперечисленных ключевых слов, а
именно:
1. СЕО;
2. биржа трафика
3. Про биржа крипто;
4. биржа рафика;
5. таргет биржа
Наши Теги: ГЕО, coin, заработок трафик, таргетинг реклама,
биржа трафика.
Доброго Вам Дня! https://t.me/seovtop/335
Привет,
Друзья.
В данный момент я бы хотел поведать малость про купить ссылку с сайта.
Я думаю Вы искали именно про куплю ссылки
на оптовых поставщиков одежды?!
Значит эта больше актуальная
информация про купить ссылку за 1 рубль будет для
вас наиболее полезной.
Мы предлагаем больше полезностей про купить ссылку
это как а также про куплю ссылки на вашем сайте что это
На нашем сайте больше про купить ссылки для одной страницы – Наш сайт — https://tumblr.com/seoquantum или про
купить ссылку в группе в vk
Только, если Вы реально искали информацию про купить ссылок с твиттера,
На нашем сайте Вы найдете много предложений для как купить ссылку на ротапост – а именно про купить
на всегда ссылку на сайт и про купить
ссылки на сайт у яндекса.
1. купить ссылки 5 рублей
2. купил ссылок
3. Про купить ссылки с переходами
4. купить ссылку с блогах
5. купить ссылки на сайт бесплатно
6 Про купить ссылки с порно
Добро пожаловать к нам на сайт
про купить тематические вечные ссылки.
Наши Теги: купить ссылки для трафика, купить временные
ссылки на сайт, как купить сразу много ссылок,
куплю ссылку сайта, как купить плохие ссылки.
Доброго Вам Дня! https://tumblr.com/seoquantum
Здравия Желаю,
Коллеги.
В данный момент я бы хотел оповестить малость про 63 Max
Я думаю Вы мыслите именно про 63 Max или
возможно желаете поведать больше
про 63 Max?!
Значит эта больше актуальная информация
про 63 Max будет для вас наиболее полезной.
На нашем веб сайте малость больше про
63 Max, также информацию про 63 Max.
Узнай Больше про 63 Max по ссылке https://openmachinery.net/index.php/User:BeauShirk2
Наши Теги: 63 Max, 63 Max, 63 Max, 63 Max,
Удачного Дня https://xn--b1ag1aichc6e.xn--p1ai/author/jillianc394/
Салют,
Дорогие Друзья.
Сейчас я бы хотел оповестить малость про Fit7
Я думаю Вы мыслите именно про Fit7 или
возможно желаете найти больше про Fit7?!
Значит эта оптимально актуальная информация про Fit7
будет для вас наиболее полезной.
На нашем сайте малость больше про
Fit7, также информацию про Fit7.
Узнай Больше про Fit7 по ссылке https://www.basee6.com/index.php?page=user&action=pub_profile&id=401899
Наши Теги: Fit7, Fit7, Fit7, Fit7,
Удачного Дня https://backpacking101.com/mw14/index.php?title=Fit7
Салют,
Дорогие Друзья.
Сейчас я бы хотел оповестить малость про Fit7
Я думаю Вы мыслите именно про Fit7 или возможно желаете найти больше
про Fit7?!
Значит эта оптимально актуальная информация про Fit7 будет для вас
наиболее полезной.
На нашем сайте малость больше про Fit7, также информацию про Fit7.
Узнай Больше про Fit7 по ссылке
https://www.basee6.com/index.php?page=user&action=pub_profile&id=401899
Наши Теги: Fit7, Fit7, Fit7, Fit7,
Удачного Дня
Добрый День,
Друзья.
Сейчас я бы хотел рассказать немного про Roots
Я думаю Вы мыслите именно про Roots
или возможно хотите поведать больше про Roots?!
Значит эта наиболее актуальная информация про Roots будет для
вас наиболее полезной.
На нашем веб портале больше больше про Roots, также информацию
про Roots.
Узнай Больше про Roots по ссылке http://ivf-potsdam.com/index.php?title=Benutzer:AngelitaBlunt92
Наши Теги: Roots, Roots, Roots, Roots,
Удачного Дня https://intertino.it:443/wiki/index.php?title=User:PabloChristianse
Салют,
Коллеги.
Сегодня я бы хотел оповестить малость про Little Big
Я думаю Вы думаете именно про Little Big или возможно желаете найти больше про Little Big?!
Значит эта наиболее актуальная информация про Little
Big будет для вас наиболее полезной.
На нашем сайте больше больше про Little Big, также информацию про Little Big.
Узнай Больше про Little Big по ссылке http://www.dotank.kr/bbs/board.php?bo_table=free&wr_id=168367
Наши Теги: Little Big, Little Big, Little Big,
Little Big,
Удачного Дня https://haderslevwiki.dk/index.php/Brugerdiskussion:LeomaW180535225
Салют,
Друзья.
Сейчас я бы хотел поведать немного про UZspace
Я думаю Вы думаете именно про UZspace или возможно желаете поведать
больше про UZspace?!
Значит эта наиболее актуальная информация про
UZspace будет для вас наиболее полезной.
На нашем веб портале немного больше
про UZspace, также информацию про
UZspace.
Узнай Больше про UZspace по ссылке https://hydrealty.in/author/tanyatraver/
Наши Теги: UZspace, UZspace, UZspace, UZspace,
Удачного Дня http://bwiki.dirkmeyer.info/index.php?title=Benutzer:MargieTrevizo5
Здравия Желаю,
Друзья.
В данный момент я бы хотел рассказать немного
про order backlinks search.
Я думаю Вы в поискее снова про easy backlinks list!
Поэтому эта наиболее актуальная информация про easy dofollow backlinks будет для вас сто процентов будет полезной.
Мы предлагаем больше полезностей про order backlinks checker
или про order backlinks free, возможно и про order backlinks for beginners?
На нашем сайте больше про easy do follow
backlinks,
Гарантированные ссылки! Качественные обратные ссылки проверенные опытом!
НАШ SEO WEBSITE – easy dofollow backlinks: https://ajuda.cyber8.com.br/index.php/User:RichUpton97 – 2025 easiest way to get backlinks
Только, если Вы реально искали
информацию про order backlinks meaning, а также
про backlinks bekommen, та вы найдете самую свежую и актуальную информацию про order
backlinks example или возможно хотите купить
ссылки.
Вы найдете много предложений для
backlink ideas – а именно про order backlinks types и про order
backlinks definition.
Входите с нами в контакт на нашем сайте и
вы наверняка найдете популярную и самую актуальную
информацию от экспертов по поводу следующих тем касающихся нижеперечисленных ключевых
слов, а именно:
1. Order backlinks explained;
2. Backlink ideas
3. Про order backlinks for dummies;
4. How to get more backlinks;
5. Easy do follow backlinks
Наши Теги: Easy backlinks for seo, easy backlinks reddit, order backlinks generator, order backlinks
list, backlinks bekommen.
Доброго Вам Дня! http://rank.isra.com/index.php?a=stats&u=sheila08c51
Добрый День,
Коллеги.
В данный момент я бы хотел оповестить немного про tripscan
Я думаю Вы ишите именно про трипскан?!
Значит эта больше актуальная информация
про трипскан вход будет для вас наиболее полезной.
Мы предлагаем больше полезностей про трипскан вход
На нашем сайте больше про tripscan, также про tripscan
Ссылка на сайт https://tripsc68.cc или смотри про tripscan
Только, если Вы реально искали информацию про
tripscan,
найдете самую свежую и актуальную информацию про сайт трипскан
Добро пожаловать к нам на сайт про трипскан вход
Удачи Вам.
Наши Теги: сайт трипскан, трипскан вход, https://tripsc68.cc
About blue mountains one day tour
Good Day Guys,
if you really think about blue mountain day tour
from sydney?! We have detailed information about
blue mountain day tour from sydney
I’ve spent years taking visitors around these mountain ranges, and every time I start
a day trip, I’m reminded just how remarkable this region is.
In this guide, I’ll show you the lowdown on putting
together the best one-day visit — the kind of straightforward advice that’s useful if
you’re new to the area.
Whether you join Wildlife Tours or travel independently, you’ll find
the Blue Mountains are more than just a selfie of the sandstone formation.
From fern-filled forests to heritage buildings,
from the thrills of rides to hidden swimming holes, these UNESCO World Heritage-listed mountains have loads you can squeeze into a short visit — if you plan well.
### Making a Day Trip Feel Like the Real Deal
A single day might not sound like much, but believe me — with a bit of know-how,
you can fit more into a one-day trip than most travellers manage in a extended trip.
Spots like Blue Mountains National Park, the valley,
and the clifftop are close together, so you can connect
scenic stops, falls, and heritage towns to plan a easy route
without being stressed.
Begin in the morning, stay hydrated (the dry mountain air will surprise you), and chuck a jacket even on warm days, because the altitude
can cool quickly by the evening.
And if you’re with small-group guides, you’ve got the
advantage — they’ve refined their itineraries to skip queues and make it smooth.
internet portal about blue mountains sightseeing tour please click https://myhealthmyworld.org/ for Sign up for a free consultation now! https://myhealthmyworld.org/
About penguin tour phillip island
Good Day Girls,
Really think about phillip island day trip from melbourne?!
We have detailed information about phillip island day trip
Stepping into this Phillip Island day tour package with me,
Paul Beames is a bit like flipping through my guidebook scraps — coffee-stained pages full of real insights about
hidden lookouts.
If you’re thinking about a Phillip Island tour, get ready for a
proper Aussie outing of coastal strolls, Bass Coast
breezes, and nature highlights to refresh any
city-slicker.
This rundown takes you through Koala Conservation Centre, with practical tips you
only get from hands-on tours.
And as an Aussie, I’ll share the essentials — from planning stops to the best operators who’ve nailed the itinerary.
### ?? Why This Day Tour Works So Well
Think of Phillip Island as Australia’s coastal zoo:
– Penguins waddling home
– Seals lounging on rock shelves
– lazy wildlife encounters
The beauty of this Phillip Island day tour is that it bundles the highlights without you planning every detail.
No need to book accommodation — just join the group, let
the day roll, and make the most.
site about phillip island day trip from melbourne please click
https://chinatransonline.com/ for Sign up
for a free consultation now!
Tags: Penguin island tours melbourne, philip
island tour, philip island day tour, https://chinatransonline.com/
Good health,
Friends.
At this moment I would like to reveal a little about website
I think you think specifically about site or perhaps
want to learn more about website?!
So this most up-to-date information about site will be the most useful for you.
On our web site a little more about website,
also information about site.
Find out more here
home page at https://coolizermotor.com/czym-roni-si-podejcia-do-hazardu-w-ronych/
website at https://kancelariamr.pl/jak-zwikszy-swoje-szanse-na-wygran-w-grach/
home page at http://qsbehavior.com/zaawansowany-przewodnik-po-kasynach-sekrety-2/
Our Tags: Website, home page, https://recng.com/jak-krok-po-kroku-zdoby-dowiadczenie-w-grze-w/
Hello,
Colleagues.
At this moment I would like to tell a little about site
I think you are thinking specifically about home
page or perhaps want to learn more about website?!
So this optimally up-to-date information about home page will be the
most useful for you.
On our site a little more about site, also information about website.
Find out more here
home page at https://nellhaond-portfolio.fr/apercu-complet-des-casinos-comment-maximiser-vos/
website at https://linkshop.sn/decouvrez-les-bases-essentielles-du-jeu-d-x27/
website at https://fmrc2019.cfps.sg/les-paris-un-reflet-des-dynamiques-sociales/
Our Tags: Site, site, https://fmrc2019.cfps.sg/les-paris-un-reflet-des-dynamiques-sociales/
Здравия Желаю,
Коллеги.
В данный момент я бы хотел оповестить малость про сайт
Я думаю Вы искали именно про наш сайт или возможно желаете поведать больше про подробнее?!
Значит эта наиболее актуальная информация
про сайт будет для вас наиболее полезной.
На нашем веб сайте малость больше про подробнее,
также информацию про сайт.
Узнай Больше
home page по ссылке http://www.eurostarinc.com/gde-nachat-rukovodstvo-dlja-novichkov-po-azartnym/
сайт по ссылке http://bbilnuovo.it/2026/04/29/poshagovoe-rukovodstvo-po-uspeshnoj-strategii-igry-2/
Наши Теги: наш сайт, home page,
Удачного Дня http://enhancedhealthcarepc.com/istorija-azartnyh-igr-ot-drevnosti-do-7/
Good day,
Colleagues.
At this moment I would like to inform a little about website
I think you searched specifically about home page or perhaps want to learn more about site?!
So this most up-to-date information about website will be
the most useful for you.
On our web site a little more about home page, also information about website.
Find out more here
site at http://www.medidocs.com/public/zaskakujce-historie-hazardowe-ktore-zmieniy-ycie/
home page at https://pneumec.in/jak-dziaa-mosbet-kompleksowy-przegld-kasyn-online/
website at http://getworkeurope.de/index.php/2026/04/29/historie-znanych-graczy-co-tak-naprawd-kryje-si-za/
Our Tags: Home page, home page, http://niedzwiedzia.pl/rozpoznaj-uzalenienie-od-hazardu-jak-mosbet-moe/
Салют,
Коллеги.
Сейчас я бы хотел рассказать больше про
website
Я думаю Вы мыслите именно про наш
сайт или возможно хотите найти
больше про home page?!
Значит эта оптимально актуальная информация про
наш сайт будет для вас наиболее полезной.
На нашем веб портале больше больше про website, также информацию про наш сайт.
Узнай Больше
home page по ссылке http://velotic.ro/ghid-complet-pentru-casino-tot-ce-trebuie-s-tii/
наш сайт по ссылке https://martinishotfilm.ro/2026/04/29/ghid-avansat-pentru-strategii-catigtoare-in/
Наши Теги: наш сайт, подробнее,
Удачного Дня https://constructii-sibiu.ro/viitorul-industriei-de-jocuri-de-noroc-tendine-i/
Link exchange is nothing else however it is just placing the other person’s website link on your page at appropriate place and other person will also do similar in favor of you. http://seosecretservice.top